
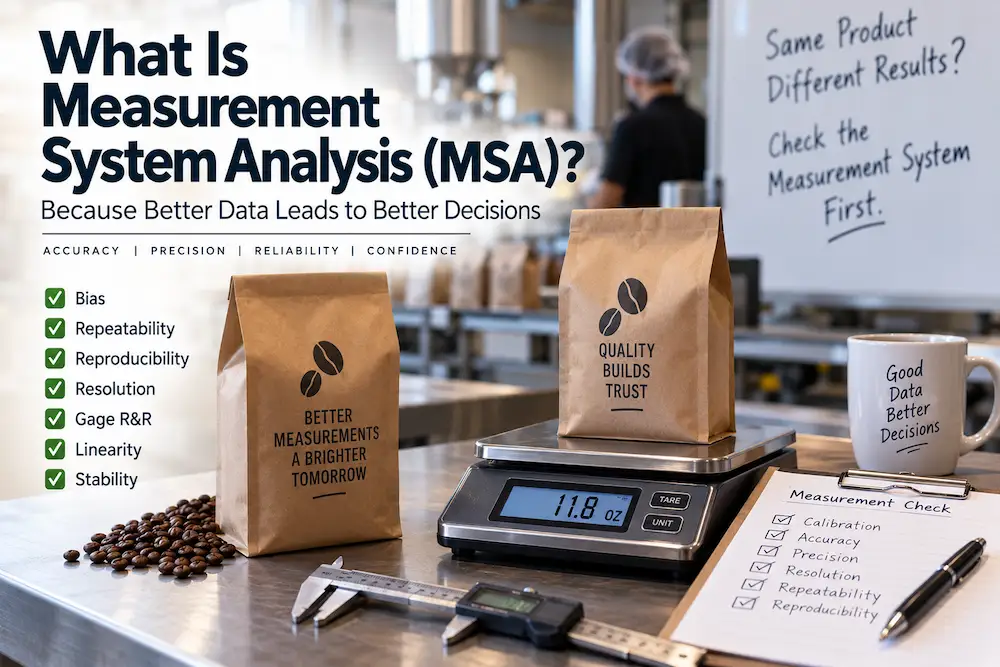
The complaints start small: a handful of customers saying their coffee subscription bag "feels light this month." Within two weeks there are enough of them that the operations manager pulls the packing log. Bags are supposed to come off the line at 12 ounces. The numbers scattered across the past month range from 11.6 to 12.4, a wider spread than he expected, and definitely wide enough to explain why some customers noticed.
His first move is the obvious one: the filling machine must be putting out inconsistent amounts, also known as "drifting." He starts adjusting it most mornings, nudging the fill setting up when the previous day's average looked a little low, down when it looked a little high. Three weeks of daily tweaking later, the complaints haven't gone away, and if anything the spread in the log looks a little wider than when he started, not narrower.
Someone on the packing floor finally asks a question nobody had thought to ask: has anyone actually checked whether the scale is right? It turns out there are two scales, one at each packing station, and when the same bag gets weighed on both, they don't agree, one reads a couple tenths of an ounce heavier than the other. Weigh the same bag twice in a row on the same scale, and even that doesn't always come back identical. The filling machine might be perfectly fine. Nobody can actually tell, because the tool being used to check it can't be trusted to tell the truth in the first place.
The Question That Has to Come Before Every Other Question
Measurement System Analysis, MSA for short, is the discipline of checking whether a measurement system, the scale, the inspector, the sensor, the procedure someone follows to take a reading, is actually giving you numbers worth trusting before you use those numbers to make a decision. It sounds almost too basic to need its own name. In practice, it's one of the most commonly skipped steps in the improvement process, because it's so tempting to assume the data is fine and go straight to analyzing it.
Here's why skipping it is so costly: every measurement contains two things mixed together, the real variation in whatever's actually being measured, and extra variation contributed by the measurement system itself. If a scale is inconsistent, some of the spread in that packing log isn't the filling machine's fault at all. It's measurement error being added on top of whatever the machine is actually doing. Adjust the machine in response to that noise, and you're not fixing anything real. You're just adding the machine's own overcorrection on top of a measurement problem that was never about the machine to begin with, which is exactly how three weeks of daily tweaking made the spread worse instead of better.
Two Different Ways a Measurement Can Fail
It helps to separate this into two distinct questions, because they point to two different kinds of fixes.
The first is accuracy: is the measurement actually close to the true value? A scale that consistently reads a quarter ounce light when checked against a known, calibrated reference weight has a bias problem. It doesn't matter how carefully or consistently it's used. It's reading wrong every single time, in the same direction, by roughly the same amount. Bias is one part of evaluating a measurement system, and it is different from the question of whether the system produces consistent results.
The second is precision, which splits into two related ideas of its own. Repeatability asks whether the same person, using the same tool, gets the same reading when measuring the same thing more than once. Reproducibility asks whether different people get the same result when measuring that same thing. The coffee bags failed both tests: the same scale gave slightly different numbers on repeated weighings of the same bag, and the two operators using different scales did not get the same result. Neither problem has to do with whether the number is close to the truth. They're about whether the measurement can be trusted to produce a consistent result.
A measurement system can fail either of these independently. A scale can be perfectly consistent, giving the exact same reading every time on the same bag, while still being wrong by a fixed amount because nobody's calibrated it in a year. A scale can also be well calibrated while still bouncing around unpredictably from one reading to the next. Knowing which failure you're actually looking at changes what needs fixing: a bias problem may require calibration or correction against a known reference, while a repeatability or reproducibility problem can point to the equipment, the measurement method, the environment, or differences between the people taking the readings.
There is also a more fundamental question: does the measurement system have enough resolution for what you're trying to measure? Resolution is the smallest change a measurement system can reliably distinguish. If you're expected to measure a dimension in millimeters but only have a ruler marked in centimeters, the tool simply cannot give you the level of detail the measurement requires. The same problem occurs if you're trying to evaluate changes measured in milliseconds but your system only records timestamps to the nearest second. No amount of repeatability or reproducibility testing can make a measurement system useful when it cannot distinguish the differences you're trying to measure. It is a fundamental limitation that can make the resulting MSA unreliable for the intended purpose.
Why This Has to Happen First, Not Later
This is exactly why measurement gets checked before anything else in a properly run improvement effort, not after the fact once a trend already looks alarming. Trying to tell whether a swing in the data is ordinary variation or a genuine signal worth investigating only makes sense once the measurement producing that data can actually be trusted. Otherwise the question being asked isn't "did the process change," it's an unanswerable tangle of "did the process change, or did the measurement just get noisier this week," and no amount of staring at the resulting chart will untangle the two after the fact.
The coffee company's ops manager was, without realizing it, treating scale noise as if it were a real signal about the filling process, then reacting to that false signal by adjusting a machine that may have needed no adjustment at all. It's the same trap as reacting to a single day's number without knowing what's normal, just one layer earlier: before asking whether a number is normal or unusual, you have to be sure the number itself is real.
Where the Concept Ends and the Real Skill Begins
Everything above is enough to understand why a measurement system needs checking and roughly what kind of problem to suspect once complaints or inconsistent data show up. Actually quantifying how much of the total variation seen in a set of measurements comes from the measurement system itself versus the real process being measured is a more rigorous exercise. One of the most common approaches is a Gage R&R study, short for Gage Repeatability and Reproducibility, where multiple operators measure the same set of parts or items multiple times. The results are then analyzed to separate repeatability variation from reproducibility variation and compare measurement variation with part-to-part variation. Gage R&R is an important part of MSA, but it is not the whole of MSA.
An ANOVA Gage R&R study goes further by using Analysis of Variance to separate sources of variation statistically. The analysis involves concepts such as sums of squares, degrees of freedom, mean squares, F-tests, and variance components. Those terms can look intimidating when they appear in a Gage R&R report, but the underlying question is straightforward: how much of what we are seeing comes from differences between the parts, how much comes from repeating the measurement, and how much comes from differences between operators? Measures such as %GRR and the number of distinct categories can then help determine whether the measurement system is providing enough discrimination for the work being done. Designing the study correctly and interpreting the results well enough to make a real decision from them is a genuine, learnable skill, and it's worth doing properly rather than guessing at from a general explanation.
Gage R&R is only one part of the broader MSA picture. Depending on the measurement system and what you need to learn about it, an MSA can also include studies of bias, linearity, stability, or the capability of a measurement instrument itself. A linearity study asks whether measurement bias changes across the operating range of the instrument. A stability study asks whether the measurement system remains consistent over time or begins to drift. Other approaches, including Type 1 Gage Studies and Attribute Agreement Analysis, apply when the measurement situation calls for them. The right study depends on what is being measured, how it is measured, and what you need to establish about the measurement system.
At Lean 6 Sigma Factory, the Green Belt MSA exercise takes this problem out of the spreadsheet and puts it into practice. Different operators are asked to measure the same characteristics, and the results can differ even when everyone believes they are following the correct approach. The differences can come from how the characteristic is interpreted, where the measurement is taken, which tool is being used, or how the measurement procedure is applied. The point isn't simply to identify who got the answer "wrong." It's to demonstrate how much variation can enter the data before anyone has even started analyzing the process. Sometimes the measurement system itself is producing the variation.
Back at the Packing Station
The actual fix, once someone finally asked the right question, had nothing to do with the filling machine. One scale was recalibrated against a known reference weight and found to be reading consistently light. The other was replaced outright after repeated checks showed it simply couldn't hold a stable reading on the same bag twice. Once both stations were weighing against equipment that could actually be trusted, the fill-weight log tightened up almost immediately, and it turned out the filling machine had been running just fine the entire time. Three weeks of daily adjustments hadn't fixed a real problem. They'd been chasing a scale that was never telling the truth in the first place.
Once a measurement can genuinely be trusted, the far more useful conversation becomes possible: watching that data over time to see what's normal for the process and what actually deserves attention, which is exactly what a control chart is built to show. None of that matters, though, until the numbers going onto it are real.
Frequently Asked Questions
1. What is Measurement System Analysis, in plain terms?
It's the practice of checking whether a measurement system, including the equipment, method, environment, and people involved in taking a measurement, can actually be trusted before using its data to make decisions. It asks whether the system produces measurements that are accurate and precise enough for the work being done.
2. What's the difference between accuracy and precision in a measurement system?
Accuracy asks whether a measurement is close to the true or reference value. Precision asks whether the measurement is consistent when repeated. Repeatability describes variation when the same operator measures the same thing repeatedly with the same equipment, while reproducibility describes variation between operators measuring the same thing.
3. What is Gage R&R and how does it relate to MSA?
Gage R&R, or Gage Repeatability and Reproducibility, is one of the most commonly used studies within Measurement System Analysis. It examines how much variation comes from repeating measurements with the same equipment and how much comes from differences between operators. An ANOVA Gage R&R can further separate these sources of variation statistically. MSA is the broader discipline, while Gage R&R is one important method used within it.
4. What are ANOVA, degrees of freedom, and sums of squares doing in Gage R&R?
ANOVA, or Analysis of Variance, is used in an ANOVA Gage R&R to separate observed variation into different sources. Sums of squares quantify variation, degrees of freedom account for the information available to estimate that variation, and mean squares are used to compare sources of variation. The resulting variance components help show how much of the observed variation comes from the parts being measured and how much comes from the measurement system.
5. What other studies are part of MSA?
Gage R&R is only one part of MSA. Depending on the measurement system, studies can also examine bias, linearity, and stability, as well as Type 1 Gage Studies and Attribute Agreement Analysis. A linearity study looks at whether bias changes across the measurement range, while a stability study looks at whether the measurement system remains consistent over time.
6. Can a measurement system be consistent but still wrong?
Yes. A tool can give the same reading every time on the same item, meaning it is precise, while still being consistently different from the true or reference value, meaning it has bias. The two problems require different investigations. A measurement system can also be accurate on average while producing too much variation from one measurement to the next.
7. Does MSA only apply to physical measurements like weight or length?
No. Any measurement system can be evaluated this way, including human judgment calls such as a quality inspector deciding whether an item is defective, or a support team scoring a customer interaction. If different people can interpret or score the same thing differently, the measurement system may have a reproducibility or agreement problem worth investigating just like an inconsistent scale.