
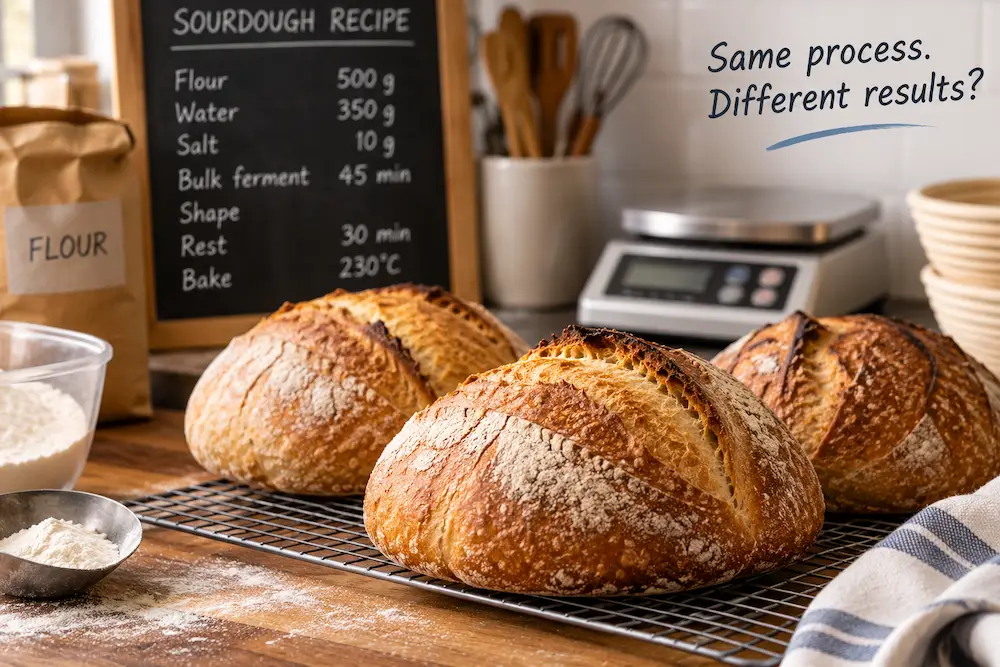
The bakery owner follows the same sourdough recipe every single day. Same flour supplier, same hydration percentage written on the card taped above the counter, same 45-minute bulk ferment, same oven. And still, every so often, a regular customer will mention that today's loaf seems a little different from last week's, a touch denser, a shade darker on the crust, a slightly different crumb. Nothing anyone's complaining about. Just noticed.
Her first instinct is to assume someone on the team is cutting a corner, and she almost brings it up at the next shift meeting. But she's the one who baked three of the "different" loaves herself, using the exact same recipe card she's used for two years. If she's getting different results from herself, the recipe isn't the problem. Something else is going on, and it's worth actually understanding what, before blaming anyone for anything.
"The Exact Same Recipe" Was Never Actually the Same
Here's the uncomfortable truth behind almost every process that produces something, food, a service call, a piece of software, a signed contract: there is no such thing as running it exactly the same way twice. It feels like there should be, especially when the recipe card, the checklist, or the standard operating procedure looks identical on paper every time. But a written procedure only captures the parts of a process someone thought to write down. Underneath it, dozens of small, mostly invisible differences are happening on every single run, and together they're what's actually responsible for the loaf that comes out a little different this Tuesday.
This is what process variation actually means: the natural, essentially unavoidable differences that show up in a process's output every time it runs, even when everyone involved genuinely believes they're doing exactly the same thing as last time. It's not a sign that something is broken. It's simply what happens whenever real people, real equipment, and real materials are involved in producing something, and understanding where that variation actually comes from is the first real step toward deciding what, if anything, is worth doing about it.
Six Places Variation Is Almost Always Hiding
Rather than guessing at a single cause, it helps to walk through the handful of categories almost every source of process variation falls into. None of them are exotic. All six show up in the bakery just as easily as they'd show up in a call center, a construction site, or a hospital ward.
The people doing the work are one source. Two experienced bakers can both follow the same shaping instructions and still produce slightly different tension in the dough, because "shape until the surface looks tight" depends on a baker's eye and years of built-up feel, not a number either of them could write down precisely. Even the same baker on two different days brings a slightly different touch depending on how rushed the morning was.
The equipment being used is another. Ovens are never perfectly uniform inside; most have a slightly hotter back corner or a cooler spot near the door, and a loaf's position on any given day changes how it bakes even at the identical dial setting. Equipment also drifts over time in ways nobody notices day to day, the same way a thermostat calibration slowly shifts, until eventually the "same" oven setting is quietly baking a little hotter than it did a year ago.
The method itself, meaning exactly how the steps are actually carried out, is a third source, and it's sneakier than it sounds. "Bulk ferment for 45 minutes" looks precise on a recipe card, but dough is often ready based on how it looks and feels, not strictly the clock, so two bakers, or the same baker on two different mornings, might pull it a few minutes earlier or later based on a judgment call the recipe never fully specified.
The materials going into the process are a fourth. Flour is an agricultural product, and different batches from the same supplier can absorb water slightly differently depending on the wheat's protein content and moisture that season. The recipe card says "same flour." The flour itself never promised to behave identically bag to bag.
The measurement being used to check the process is a fifth, and it's one that's easy to overlook entirely, on the assumption that whatever the scale or thermometer says must be correct. A kitchen scale that's slightly inconsistent, or a thermometer that reads a few degrees off, introduces variation of its own before anyone even gets to the actual dough, in exactly the way an unreliable measurement system quietly distorts what a process looks like in any industry, not just baking.
The environment surrounding the process is the sixth. Kitchen humidity shifts with the weather outside, and dough hydrates differently on a muggy August afternoon than it does on a dry winter morning, even with the exact same flour and water measurements. Nobody controls the weather, but it's still quietly shaping the loaf.
Using a Fishbone Diagram to Map the Possible Causes
Once you've identified the main sources of variation, the next challenge is figuring out what might actually be causing it. One of the Lean Six Sigma tools designed for exactly this purpose is the Fishbone Diagram, also known as an Ishikawa Diagram or Cause and Effect Diagram.
Rather than immediately deciding what the problem is, a Fishbone Diagram gives a team a structured way to explore the possible causes across different areas of the process. For the bakery, the six categories provide a useful starting point for asking what could be making otherwise similar loaves come out differently.
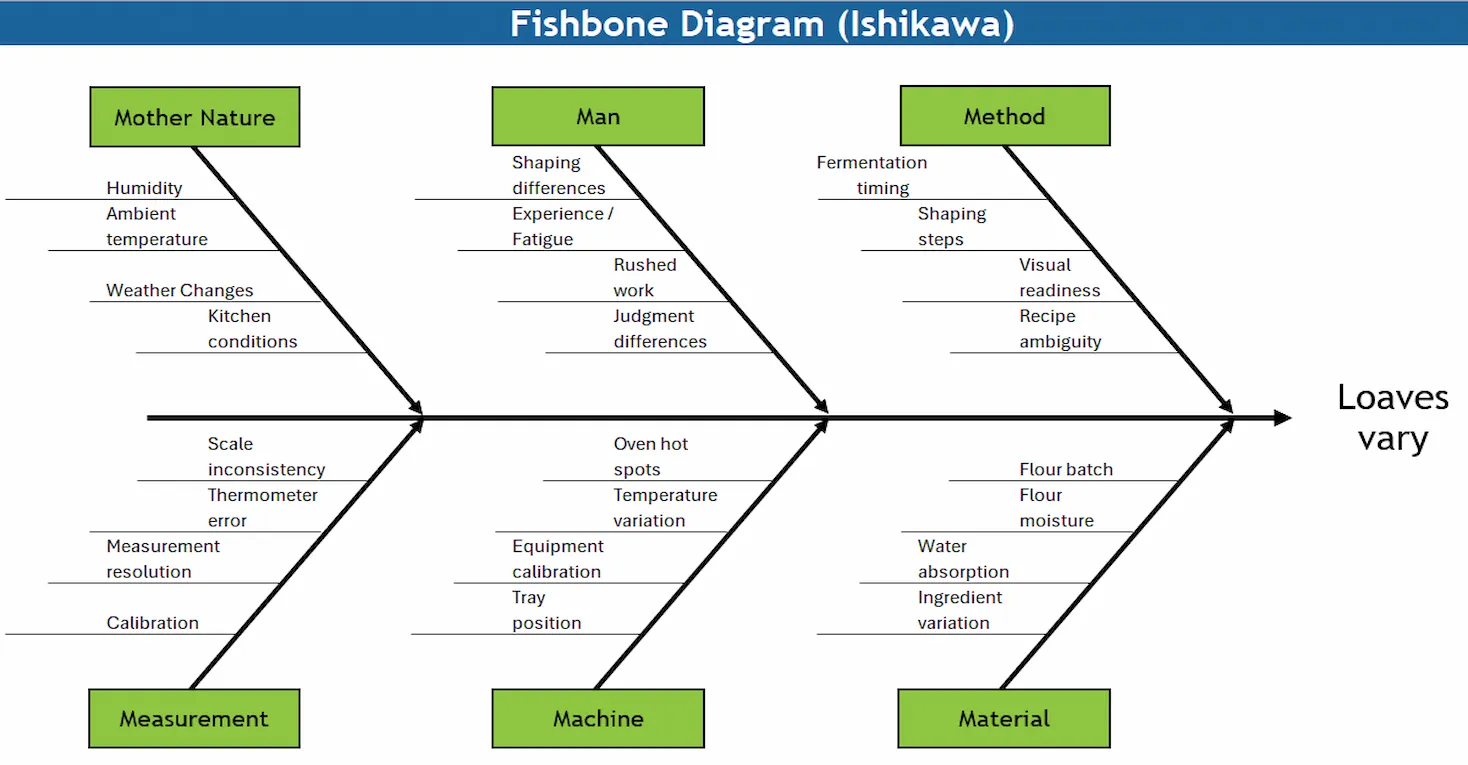
A Fishbone Diagram maps possible causes of variation across the six categories in the bakery process.
In the bakery example, the Man branch includes differences in shaping, experience, fatigue, and the judgments made by individual bakers. Method covers things such as fermentation timing, shaping steps, and how a baker decides when the dough is ready.
Machine includes oven hot spots, temperature variation, equipment calibration, and where a loaf is positioned in the oven. Material covers differences between flour batches, flour moisture, water absorption, and other ingredient variation.
Measurement considers whether the scale, thermometer, or other tools used to check the process are themselves introducing variation. And Mother Nature represents the environmental conditions surrounding the process, such as humidity, ambient temperature, and changes in the weather.
The purpose isn't to prove that every item on the diagram is causing the problem. It's to make the possibilities visible. Once the possible causes are laid out, the team can investigate them rather than simply guessing or blaming the person closest to the output.
You can use our Cause and Effect Matrix & Ishikawa Templates to build a Fishbone Diagram like this for your own process.
Why Naming the Source Actually Matters
None of this means every one of these six sources deserves the same amount of attention, and trying to lock all of them down equally would be its own kind of waste, spending real effort tightly controlling something that was never actually causing the problem. The value of walking through the six categories deliberately, instead of guessing, is that it turns a vague "the loaves seem inconsistent lately" into a short, specific list of real candidates worth checking, rather than an assumption that lands, usually unfairly, on whichever person happened to be working the day someone noticed.
It also reframes what "fixing" variation actually looks like. The instinct is often to blame the person closest to the output, the baker who shaped today's loaf, the rep who took today's call, when the real driver just as often turns out to be a batch of material that behaves differently, a tool that's quietly drifted out of calibration, or a step in the method that was never actually specific enough to be done the same way twice. Fixing the wrong one wastes effort and, worse, damages trust with the person who got blamed for something that was never really within their control.
Where the Concept Ends and the Measurement Begins
Everything above is enough to generate genuinely useful hypotheses about where variation in a process is likely coming from. Actually quantifying how much each of those six sources contributes to the total variation seen in the output, separating out exactly how much belongs to the people, how much to the equipment, how much to the materials, is a more rigorous exercise, usually involving carefully designed studies that isolate one factor at a time. Learning to design and run that kind of study properly is a real, valuable skill, and it goes well beyond what a single article can responsibly teach. What matters here is simpler and more immediately useful: knowing the six places to look before jumping to a conclusion about the seventh place, which is usually blame.
Back at the Bakery
Walking through the six sources with her team instead of guessing, the owner finds the pattern almost immediately once she looks for it: the "different loaf" comments line up suspiciously well with the timing of a new flour delivery three weeks earlier. Nobody had changed the recipe, the oven, or the shaping technique. The wheat behind this batch of flour was simply absorbing water a little differently than the previous one. The fix wasn't a stricter checklist or a talking-to for whoever baked that morning. It was a small hydration adjustment tied specifically to each new flour delivery, tested and confirmed before it became the new standard.
Knowing where the variation was actually coming from also set up the next useful question, the one this blog has already covered: once you know a source like flour batches genuinely affects the loaf, the follow-up is deciding whether a given day's result is ordinary variation worth leaving alone, or a real signal worth investigating. Naming the source and judging the signal are two different steps, and skipping straight to the second without ever doing the first is how so many process problems get blamed on the wrong thing entirely.
Frequently Asked Questions
1. What is process variation, in plain terms?
The natural, largely unavoidable differences that show up in a process's output every time it runs, even when the people involved believe they're following the exact same steps as before. It comes from many small factors acting together rather than one obvious cause.
2. What are the main sources of process variation?
They're often grouped into six categories: the people doing the work, the equipment being used, the specific method or steps followed, the materials going into the process, the measurement system used to check it, and the surrounding environment. Almost any inconsistency in a process traces back to one or more of these.
3. Why shouldn't the person closest to a problem automatically get the blame?
Because the actual driver of variation is just as often a material that behaves differently, equipment that's drifted out of calibration, or a step in the process that was never precisely defined, none of which the person carrying out the work necessarily has control over. Blaming the wrong source wastes effort and damages trust.
4. Does reducing variation mean eliminating it completely?
No, and trying to would usually be wasteful. Not every source of variation is worth tightly controlling. The goal is identifying which sources are actually meaningful contributors to a real problem and focusing effort there, rather than treating every possible source as equally urgent.
5. How does measurement fit in as a source of variation?
An inconsistent or poorly calibrated measurement tool can introduce variation of its own before the actual process is even evaluated, making the output look more inconsistent than it really is, or masking a real inconsistency entirely. Checking whether a measurement system can be trusted is its own step, worth doing before drawing conclusions from the data it produces.
6. Is identifying the source of variation the same as knowing whether it's a real problem?
No, they're two separate questions. Identifying the source explains where variation is coming from. Deciding whether a specific result is ordinary for the process or an actual signal worth investigating is a separate judgment, typically made by comparing it against the process's established normal range.