
Every Monday morning, the marketing manager opens the dashboard and looks at yesterday's conversion rate. On a good week it's 3.4%. This week it's 2.9%, and by 9:15 there's an emergency meeting on the calendar. Homepage copy gets rewritten by lunch. The call-to-action button changes color. Somebody suggests the checkout flow has too many steps, so a step gets cut. By Thursday, conversion is back up to 3.3%, and the meeting gets remembered as the day the team turned things around.
Except nothing was actually turned around. Conversion rate bounces around every single week, for dozens of reasons nobody tracks: which day of the week it was, what the weather did to browsing habits, whether a competitor ran a sale, whether Tuesday's traffic happened to skew toward people who were further along in deciding to buy anyway. Thursday's 3.3% wasn't proof the redesign worked. It was the number doing what it always does, drifting back toward its normal range, the same way it would have with or without a single change.
This happens to be one of the oldest, best-documented traps in the entire discipline of process improvement, and it has a name most people have never heard even though they fall into it weekly: reacting to variation as if every wiggle in the data means something, when most of the time it doesn't mean anything at all.
The Experiment That Proved the Trap Is Real
In the 1980s, the statistician W. Edwards Deming ran a deceptively simple demonstration that's still used to teach this idea today. Drop a marble through a funnel aimed at a target on a table. The marble almost never lands exactly on the target, because there's natural, unavoidable scatter in how it rolls and settles. Leave the funnel exactly where it is and drop marble after marble, and you get a cluster of landing points scattered around the target in a fairly tight, predictable pattern.
Now try to "help." After each marble lands, move the funnel to compensate, shifting it left if the last marble landed right, right if it landed left, trying to correct for whatever just happened. According to the Deming Institute's own account of the experiment, this constant well-intentioned correcting doesn't tighten the pattern. It blows it wide open. The marbles end up scattered far more widely than if the funnel had simply been left alone, and in the more aggressive versions of the adjustment rule, the pattern doesn't even stay centered on the target, it walks steadily away from it, drop after drop.
Deming called this tampering: adjusting a process in response to a single result, when that result was never actually telling you anything worth reacting to in the first place. The marketing manager rewriting the homepage over a normal Tuesday dip is doing exactly what the person nudging the funnel after every marble was doing. Both are treating ordinary noise as if it were a message.
Two Kinds of Variation, and Why Mixing Them Up Is Expensive
Every process that produces a number, conversion rate, delivery time, support ticket volume, daily revenue, defect count, has some amount of variation baked in. None of it repeats exactly the same way twice. The question that actually matters isn't whether a number moved. It's whether that movement falls inside the range the process normally produces on its own, or whether something genuinely changed.
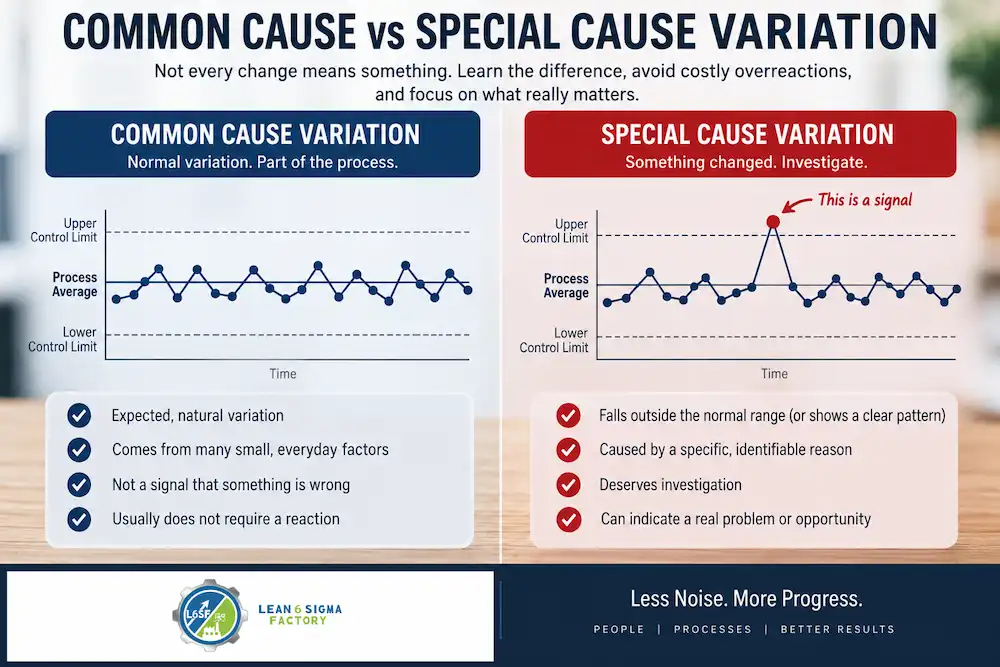
Variation that falls inside the process's normal, expected range is called common cause variation. It's the scatter around the target when the funnel is left alone: real, measurable, sometimes frustrating, but not a signal. It comes from the ordinary combination of small factors every process has running in the background, and no single one of them is worth chasing down individually, because they're not the actual problem. The dip from 3.4% to 2.9% almost certainly falls into this category. It's the site's normal week-to-week scatter, nothing more.
Variation that falls outside that normal range, or that forms a pattern too consistent to be random chance, is called special cause variation. This is the process telling you something genuinely changed: a specific, identifiable, assignable reason showed up that wasn't there before. A payment gateway that started silently failing for one browser. A new competitor's ad campaign siphoning off a specific segment of traffic. A pricing page that got mistakenly published with the wrong currency. These are real, findable causes, and they deserve investigation, fast.
The expensive mistake runs in both directions. Treat common cause variation like it's special, and you get the marketing manager's Monday: a redesign chasing a random dip, a "fix" that gets credited for a recovery that would have happened anyway, and a process that gets a little more chaotic and unpredictable every time somebody tampers with it in response to normal noise. Treat special cause variation like it's common, and you get the opposite failure: a real, fixable problem gets waved off with "the numbers bounce around all the time" while it quietly gets worse, because nobody stopped to ask why this particular drop looked different from all the ordinary ones.
How to Actually Tell the Difference
The instinct most people have is to compare today's number to yesterday's number. That's exactly the comparison that gets people into trouble, because any single point looked at against any other single point can look dramatic even when nothing real happened. The comparison that actually matters is a point against the process's own established range of normal behavior, built from enough historical data to know what "normal" genuinely looks like for that specific process.
A few practical signals are usually strong enough to trust without any formal statistics. A single point that falls far outside where the process has ever landed before is worth a look. A run of several points in a row, all on the same side of the average, is worth a look, because pure randomness rarely lines up that neatly for that long. A clear, steady trend in one direction across many points in a row is worth a look, for the same reason. A single ordinary-looking point sitting comfortably inside the range the process bounces around in every week, on the other hand, usually isn't worth a meeting.
There's a whole formal methodology built around making this distinction rigorously and repeatably, using tools called control charts, which plot a process's data over time against statistically calculated limits instead of gut feeling. Learning to build and read one properly, choosing the right chart for the right kind of data, calculating meaningful limits, and applying the specific rules that flag a genuine signal, is a real, teachable skill, and it's worth learning properly rather than approximating from a blog post. What matters here is the underlying judgment call those tools are built to support: before reacting to a number, ask whether you're looking at the process's normal scatter or an actual signal, because the two call for completely different responses.
What to Actually Do With Each One
When the movement is common cause, the correct response is almost never to react to that single data point at all. If the overall level of variation is genuinely too wide for the business, too many days with conversion below what's sustainable, too much scatter in delivery times, the fix is a structural change to the process itself, made deliberately and tested properly, not a reflexive tweak made the same afternoon a number looked bad. Fixing the system takes patience. Reacting to a single point takes an afternoon and usually makes things worse.
When the movement is special cause, the correct response is the opposite: investigate that specific point in time immediately. What changed right there? A deployment, a vendor issue, a pricing error, a policy change, a new competitor. The goal isn't a system-wide overhaul. It's finding the one specific, assignable thing that broke and fixing that thing, because everything else about the process was working exactly as it always had.
Getting this backwards is how organizations end up simultaneously over-managed and under-managed: constantly overreacting to ordinary noise while a genuine, fixable problem sits ignored under the excuse that "it's just normal variation." Both failures come from skipping the same step, actually checking which kind of variation you're looking at before deciding what to do about it.
Back to Monday Morning
The better version of that marketing meeting doesn't start with "conversion dropped, what do we change." It starts with a simple question: is 2.9% actually outside the range this site normally produces, or is this just an ordinary Tuesday? If the site has historically bounced between 2.7% and 3.6% on a normal week with no changes at all, 2.9% isn't news. It's Tuesday. The team that keeps a running sense of that normal range stops calling emergency meetings over ordinary noise, and saves its actual urgency for the week the number falls to 1.8% and stays there for four days straight, which is exactly the kind of signal worth dropping everything for.
It's worth noting that this idea sits right next to another one already covered on this blog: a process has to actually behave predictably, free of unpredictable special causes, before a capability number like Cp or Cpk means anything at all. A process that's swinging around due to unaddressed special causes doesn't have a stable, meaningful capability yet. It has chaos with a number attached to it. Stability comes first. Capability is the question that gets asked once stability is no longer in doubt.
Read the article here: Cp vs Cpk: Process Capability Analysis Explained
Frequently Asked Questions
1. What's the simplest way to tell common cause and special cause variation apart?
Compare a data point to the process's own established normal range, built from enough history to know what typical variation looks like, rather than comparing it to just the previous data point. A single value inside that established range is usually common cause. A value clearly outside it, or a long run of points trending consistently in one direction, is usually worth investigating as a special cause.
2. Why does reacting to common cause variation actually make things worse?
Demonstrated by Deming's funnel experiment, adjusting a stable process in response to normal, expected variation adds extra, unnecessary movement on top of the variation that was already there, widening the overall spread of results rather than tightening it. This effect is often called tampering.
3. What happens if a real problem gets dismissed as common cause variation?
It tends to get worse quietly. Treating a genuine, assignable problem as if it were just normal noise means nobody investigates the actual cause, so whatever changed keeps affecting the process unchecked until the damage becomes large enough that it's impossible to ignore.
4. Do you need a control chart to make this distinction?
Control charts are the formal, statistically rigorous way to make this call reliably and repeatably, and they're worth learning properly rather than approximating. That said, a few practical signals, a point far outside the normal range, several points in a row on one side of the average, or a clear sustained trend, are usually strong enough to flag something as worth a closer look even before any formal chart is built.
5. Is variation always a bad thing?
No. Every real process has some amount of common cause variation built in, and that's expected, not a flaw to chase down point by point. The goal isn't zero variation on any single measurement. It's understanding what a process's normal range actually is, so a genuine shift outside that range doesn't get missed, and a normal day inside it doesn't trigger an unnecessary overreaction.
6. How does this relate to process capability (Cp and Cpk)?
Capability measures whether a process's normal variation fits within what customers require, but that measurement only means something if the process is stable first, meaning it's free of unaddressed special causes pulling it around unpredictably. A process still being knocked off course by special causes doesn't have a meaningful capability number yet. Stability has to come before capability is even a fair question to ask.