
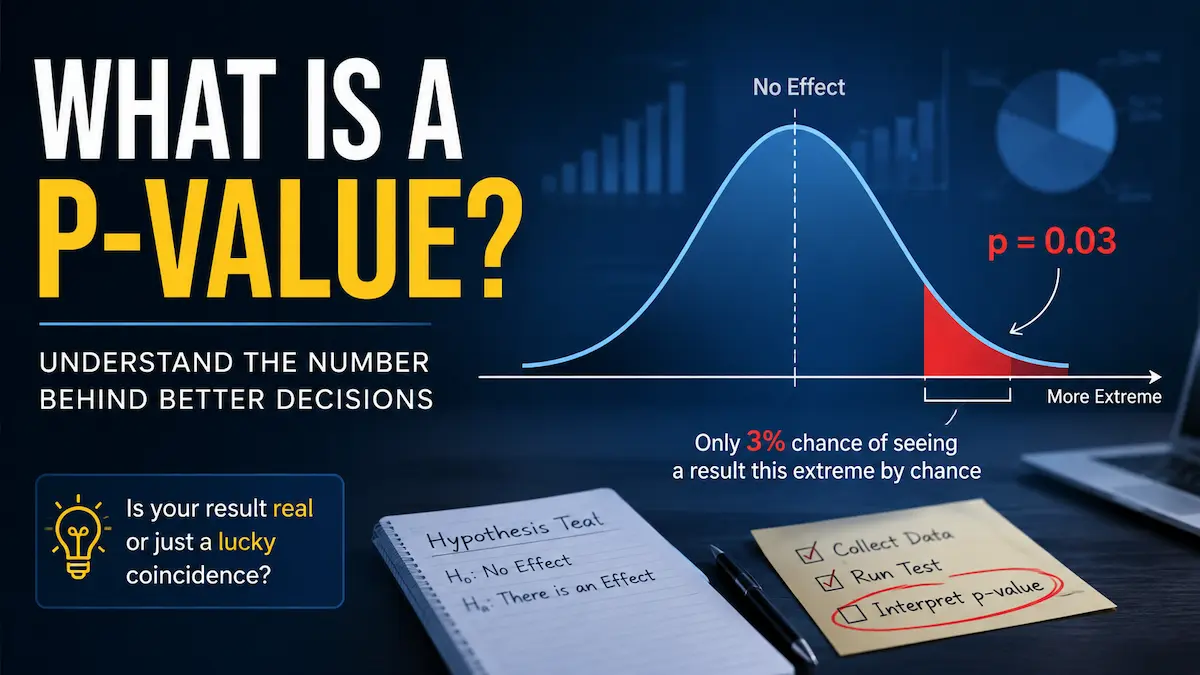
You ran the test, you pulled the results into your favorite stats software, and it handed you a number: p = 0.03. Maybe it also gave you a confidence interval, a few decimal places, and a chart with error bars. Then it stopped talking, leaving you staring at the one question that actually matters: "So... did it work or not?"
Is 0.03 good? Would 0.06 have been bad? Should you roll the change out to everyone, or was this just a lucky month? This is where a lot of smart, capable professionals quietly freeze. Statistical significance is one of the most talked-about, least understood ideas in business, and almost nobody explains what to actually do with the number once you have it. That's exactly what this article is about.
By the End of This Article You'll Be Able To...
- ✔ Explain what a p-value actually measures, in plain English.
- ✔ Read a p-value your software reports and know what it's telling you.
- ✔ Tell the difference between a result that's "real" and a result that's just noise.
- ✔ Understand why "statistically significant" doesn't always mean "worth doing."
- ✔ Know what to investigate next, whichever way the number comes out.
What Is a P-Value, Really?
At its simplest, a p-value answers one question: if nothing had actually changed, how surprising would this result be?
Every business runs experiments, whether it calls them that or not. A customer support team tries a new script. An HR team tests a new interview process. A subscription business tries a new onboarding step. A hospital changes how it schedules follow-up calls. In every case, someone eventually asks the same thing: did that change actually cause the improvement we're seeing, or would we have seen roughly the same result anyway?
That's all a p-value is for. It doesn't tell you whether your idea was good. It doesn't tell you whether the result is big enough to matter. It only tells you how likely it is that you'd see a result this extreme purely by chance, if your change had done absolutely nothing at all.
Let's Follow One Real Process
Rather than jumping between examples, let's follow a single story through this article. Imagine you run a growing subscription software business. New customers sign up every day, and like most subscription businesses, you lose some of them in the first 90 days. Right now, roughly 32% of new customers cancel before day 90.
Someone on your team has an idea: what if every new customer got a short, personal welcome call in their first week? The theory is that customers who feel supported early are less likely to give up when something gets confusing. It's a reasonable idea, but reasonable ideas fail in business constantly. Before you hire a team of onboarding callers, you want to know: does this actually work?
Running the Experiment
You test it. Over the next month, new customers are split into two groups. One group gets the welcome call; the other doesn't, exactly as before. After 90 days, you compare the two groups:
- Customers who got the welcome call: 26% cancelled
- Customers who didn't get the call: 32% cancelled
That's a six-point difference. It looks like the welcome call worked. But here's the uncomfortable truth: even if the welcome call did absolutely nothing, you'd almost never see the two groups land on the exact same cancellation rate. Some randomness is baked into every group of customers you could possibly pick. Maybe this month's non-called group happened to include a few more price-sensitive customers. Maybe the called group happened to sign up during a slower, less stressful week.
So the real question isn't "is 26% lower than 32%?" It obviously is. The real question is: is this gap big enough that it probably isn't just random luck? That question is exactly what a p-value is built to answer.
The "Boring Explanation" Your Software Is Testing Against
Here's the part almost nobody explains clearly. Before your software calculates a p-value, it quietly assumes the most boring possible explanation is true: that the welcome call changed nothing, and any difference you saw between the two groups was pure chance.
Statisticians call this the "null hypothesis," but you don't need the jargon. Just think of it as the boring explanation — the assumption that nothing interesting happened, and the two groups are really no different underneath the noise.
Your software then asks: if the boring explanation were true, how often would we see a gap of six points or more, just from random luck alone? The answer to that question, expressed as a probability between 0 and 1, is your p-value.
So Is p = 0.03 Good News for Your Welcome Call?
Your software runs the numbers and reports: p = 0.03. Here's what that means, translated directly into your decision: if the welcome call had truly changed nothing, you'd only see a gap as large as 32% vs. 26% about 3 times out of 100 tests, purely by chance.
That's unlikely enough that "we just got lucky" stops being the most believable explanation. In plain terms: yes, this is good news — the drop probably reflects something real, not random noise. But notice what p = 0.03 hasn't told you yet. It hasn't told you whether the welcome call is worth the cost of running it, whether it should go to every customer or just some, or whether a cheaper idea might work just as well. "Real" and "worth doing" are two different questions, and only the first one has been answered so far — we'll work through the second one below, with real numbers.
Why 0.05 Became the Line in the Sand
Most software defaults to flagging results as "significant" when p is below 0.05 — meaning there's less than a 5% chance you'd see a result this extreme if nothing had actually changed. That threshold isn't a law of nature. It's a convention, chosen decades ago, because it strikes a reasonable balance between two mistakes: declaring victory on something that was really just noise, and dismissing something real because you weren't quite convinced.
Think of 0.05 the way you might think of a smoke detector's sensitivity. Set it too loose, and it never goes off, even during an actual fire. Set it too sensitive, and it screams every time you make toast. 0.05 is simply where most industries have agreed to set the dial, not because it's magic, but because it's a workable default.
Interpreting Your P-Value
Once you understand what the boring explanation is testing against, the scale becomes much easier to read.
p greater than 0.05
The gap you saw is small enough that plain luck is still a perfectly believable explanation. You don't have solid evidence the welcome call did anything. That doesn't necessarily mean it failed — it might mean you don't have enough data yet, or the effect is real but small. Either way, the honest next question isn't "why didn't it work?" It's "do I have enough evidence to know either way?"
p equal to roughly 0.05
You're right on the edge. Some organizations treat this as significant, others don't. Rather than agonizing over a single test crossing an arbitrary line, this is usually a sign to gather more data before making a big decision.
p less than 0.05
The gap is unlikely to be random luck. Something is probably really going on. That's useful — but notice it still hasn't told you the most important business question yet, which is coming up next.
The Question Your Software Never Asks: "Does It Matter?"
Here's where most people go wrong, and it's the single most important idea in this article: statistical significance and business significance are not the same thing.
A p-value only tells you whether an effect is probably real. It says nothing about whether that effect is big enough to be worth your time, budget, or a company-wide rollout. Imagine your test had involved 50,000 customers instead of a few hundred. With that much data, even a tiny, meaningless difference — say, cancellation dropping from 32.0% to 31.8% — could easily produce a p-value below 0.05. Technically "significant." Practically irrelevant.
That's why the next step after seeing a low p-value should never be "ship it immediately." It should be: "Is this effect big enough to be worth doing something about?"
Three Scenarios, and What to Actually Do in Each
A p-value only ever answers half the question. Here's the other half — the business case — worked through with real numbers, using the same welcome-call test.
Scenario 1: Low p-value, and the effect is meaningfully large
p = 0.03, cancellation drops from 32% to 26%.
This is the result you want: it probably isn't luck, and the gap is large enough to matter. But before rolling anything out, run it through a filter no p-value can do for you — does this actually make business sense?
Say you have roughly 1,000 new customers a month. At the old 32% cancellation rate, that's 320 lost customers a month. At 26%, it's 260 — a difference of 60 retained customers every month. If a retained customer is worth roughly $1,100 in additional revenue over the months they stick around past day 90, that difference is worth about $66,000 in protected revenue a month.
Now price out the program. Welcome-calling 1,000 new customers a month might require two onboarding specialists, at a loaded cost of roughly $10,800 a month. Set the two against each other: $66,000 in protected revenue against $10,800 in cost leaves a net benefit of about $55,200 a month. That's the number that actually justifies the program — the p-value only got you in the door.
Before you commit budget and headcount, a few more questions are worth answering:
- Does every customer need a call, or would your highest-value customers — who have the most revenue worth protecting — capture most of the benefit at a fraction of the cost?
- Is there a cheaper way to get a similar lift, such as a personalized video or email from the CEO, worth testing before locking in a live-call program?
- Will the effect hold up once it's routine? A pilot program sometimes works partly because it's new and someone is paying extra attention — that lift can fade once it becomes just another step in the process.
None of these questions have a single right answer, and none of them come from statistics software. They come from treating the p-value as a green light to start asking the real business questions, not as the finish line.
Scenario 2: Low p-value, but the effect is tiny
p = 0.02, cancellation drops from 32.0% to 31.7%.
This is the trap. The number is "significant," so it's tempting to announce a win. Run the same business case here: a 0.3-point improvement on 1,000 customers is roughly 3 retained customers a month, worth about $3,300 in protected revenue. Against the same $10,800 monthly program cost, that's a net loss of about $7,500 a month. The effect may well be real — real and unprofitable can absolutely coexist. Before committing budget, ask: what would it cost to roll this out, and does an effect this small clear that bar? Sometimes the honest answer is "this is real, but not worth doing as-is" — which might point you toward a cheaper version of the idea rather than the expensive one you tested.
Scenario 3: High p-value
p = 0.41, cancellation drops from 32% to 30%.
You don't have strong evidence the welcome call is doing anything — the gap is well within what random chance could produce on its own. Your next move isn't necessarily to abandon the idea. It's to ask: do I have enough data to actually detect an effect this size, if one exists? A small test with a small sample often can't tell the difference between "no effect" and "a real but modest effect." And here the business case cuts the other way too: before spending $10,800 a month rolling this out to everyone, it's far cheaper to run a longer or larger test than to greenlight a live program on a hunch. If the effect is real but modest, a bigger sample will reveal it; if it truly isn't there, a bigger test will show that too, before a year of budget is committed to it.
The Biggest Mistake People Make With P-Values
The most common mistake isn't misreading the number — it's treating it like a verdict instead of a clue. People ask "is 0.03 good?" the same way they'd ask about a test score, as if the universe is grading their idea pass or fail.
A p-value doesn't tell you an idea is good. It tells you whether an observed difference is more likely to be real than random. What you do with that information — whether the effect is big enough to matter, whether it will hold up at scale, whether it's worth the cost of implementing — is a business judgment call that no p-value can make for you.
A related trap: testing the same idea over and over, in slightly different ways, until one version finally crosses p < 0.05, then treating that one lucky result as proof. If you flip a coin enough times, you'll eventually get five heads in a row — that doesn't mean the coin is rigged. The same logic applies to testing five slightly different email subject lines and only reporting the one that "won."
Where Lean Six Sigma Fits Into All of This
Notice that nowhere in this article did the real decision come from a formula. It came from asking good questions: Is this difference likely to be real? Is it big enough to matter? Would it hold up if we tried it again, at scale, with different customers?
That's the heart of what Lean Six Sigma actually teaches — not memorizing statistical formulas, but building the discipline to test ideas honestly before betting the business on them, whether you're running a warehouse, a support team, a hospital, or a subscription company. A p-value is just one tool in that toolkit. Knowing when to trust it, when to question it, and when to ask a better question entirely is what separates data-driven decisions from data-decorated guesses.
Final Thoughts
Software can calculate a p-value in seconds. Deciding what to do about it is the actual job. A low p-value doesn't mean "definitely do this," and a high p-value doesn't mean "definitely don't." Both are starting points for better questions, not final answers.
The next time your software hands you a p-value, resist the urge to ask "is this good or bad?" Ask instead: Is this probably real? If it's real, is it big enough to matter? And do I have enough evidence to bet on it? Those three questions will take you further than any decimal place ever will.
Frequently Asked Questions
1. What is a good p-value?
There's no universal "good" p-value — only whether it clears the threshold your organization has agreed on, usually 0.05. A p-value below that threshold suggests the result probably isn't random chance, but it says nothing about whether the effect is large enough to be worth acting on. That second question always needs a separate look at the actual size of the difference.
2. What does it mean if my p-value is exactly 0.05?
You're right at the conventional line, and reasonable people can disagree about which side to land on. Rather than treating 0.05 as a hard pass/fail cutoff, it's usually a signal to collect more data before making a costly decision either way.
3. Can a result be statistically significant but not actually matter to the business?
Yes, and this happens constantly with large sample sizes. A tiny, practically meaningless difference can still produce a very low p-value if you have enough data. Always check the size of the effect, not just whether it's "significant."
4. My test came back with a high p-value. Does that mean my idea failed?
Not necessarily. A high p-value means you don't have strong evidence of an effect, but it can also mean your test didn't include enough data to detect an effect that's genuinely there. Before scrapping an idea, ask whether the test itself was ever big enough to give it a fair chance.
5. Do p-values only apply to A/B tests?
No. Any time you're comparing two or more groups, time periods, or conditions to see whether a difference is likely to be real, a p-value can apply — customer churn, employee turnover, defect rates, response times, survey scores, and far beyond. It's a general tool for separating real effects from random noise, not a marketing-only concept.
6. What software can calculate p-values?
Most statistical and business intelligence tools can calculate p-values, including Minitab, JMP, Excel, Python, R, and many A/B testing platforms built into marketing and product tools. Which tool you use matters far less than understanding what the result is actually telling you.
7. Is a lower p-value always better?
A lower p-value means stronger evidence against the "boring explanation" of pure chance, but it isn't a scorecard to maximize. A result with p = 0.001 isn't automatically more important to your business than one with p = 0.04 — the size and cost of the effect still matter more than how small the p-value is.
8. What's the difference between statistical significance and practical significance?
Statistical significance tells you whether a result is probably real. Practical significance tells you whether that result is large enough to be worth doing something about. A responsible decision always checks both, not just the first one.