
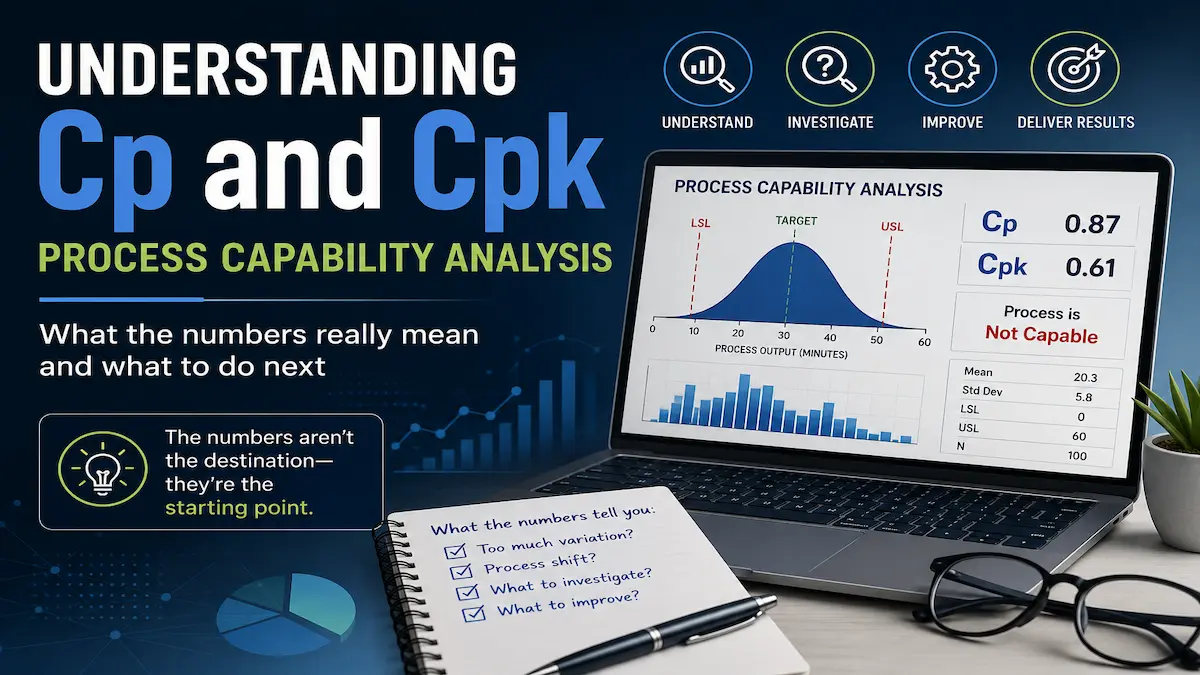
Your software doesn't care whether your process is good. It'll happily perform a Process Capability Analysis and calculate a Cp of 0.87 and a Cpk of 0.61, generating beautiful graphs, impressive reports, and plenty of decimal places. Then, it quietly hands the results back to you, leaving you with the question that actually matters: "Now what?"
Is a Cp of 0.87 good or bad? Should you start reducing variation, or has your process shifted? Should management be worried, or is everything actually working exactly as it should? This uncertainty is where many professionals become frustrated. While modern software like Minitab, JMP, KNIME, SigmaXL, Python libraries, and countless other statistical tools can calculate Process Capability in seconds, understanding what those numbers actually mean, and deciding what action to take, is a completely different challenge. That's exactly what this article is about.
By the End of This Article You'll Be Able To...
- ✔ Explain Process Capability in plain English.
- ✔ Interpret the Cp and Cpk values your software reports.
- ✔ Recognize the difference between excessive variation and a process shift.
- ✔ Know what to investigate when your process isn't capable.
- ✔ Understand how Lean Six Sigma helps build more capable processes.
What Is Process Capability?
At its simplest, Process Capability answers one fundamental business question: Can your process consistently deliver what your customer expects?
Every organization runs on processes. An online retailer processes customer orders, a hospital admits patients, a bank approves loans, a software company deploys new releases, and a Human Resources department onboards new employees. Every one of these activities is a process, and every process produces results.
However, those results are rarely identical. Some customer support tickets are resolved in ten minutes while others take thirty. Similarly, some online orders are packed almost immediately, while others spend longer waiting for inventory, payment verification, or warehouse allocation. That natural difference from one result to the next is called variation. Process Capability simply measures whether that variation is small enough for the process to consistently meet customer requirements.
Process Capability doesn't evaluate employee work ethic, nor does it track whether your software is modern or if management is doing a good job. Instead, it isolates a single, critical reality: Can this process reliably deliver what the customer expects?
Let's Follow One Real Process
Rather than jumping between different examples, let's follow a single scenario throughout this article. Imagine you own a successful online store where business is growing, customers are placing hundreds of orders every day, and your warehouse team is working hard to keep up with demand. One of your biggest competitive advantages is speed, meaning every customer is promised that their order will be ready for shipment within one hour of placing it.
Most customers don't care how your warehouse works, what ERP system you use, or which courier delivers the package. They care about a single outcome: "Will my order be ready when you promised?" That promise becomes the requirement your process must consistently achieve. If your warehouse can repeatedly prepare orders within that one-hour commitment, customers are happy. If it regularly misses that deadline, customers become frustrated, support tickets increase, and eventually, people start shopping somewhere else.
This operational reality is exactly why Process Capability exists. It isn't evaluating staff effort, warehouse expenses, or software updates. Rather, it measures whether your process can consistently deliver on the promise you've made to your customers.
Every Process Produces Variation
Let's imagine you record how long it takes your warehouse to prepare the next ten customer orders. The results look like this:
- 18 minutes
- 21 minutes
- 19 minutes
- 23 minutes
- 20 minutes
- 22 minutes
- 18 minutes
- 24 minutes
- 21 minutes
- 20 minutes
Even though every order follows exactly the same workflow, no two orders take the exact same amount of time. One customer ordered a single item while another ordered five; one warehouse employee walked a slightly longer route, and another order required an additional barcode scan. Tiny differences exist everywhere, and this is completely normal. No process produces identical results every single time.
That natural difference between one result and the next is called variation, which isn't automatically a problem. Every business process has it; the important question is whether that variation is still small enough to consistently satisfy the customer.
Why Average Performance Can Be Misleading
Many organizations make decisions using averages. On the surface, that seems perfectly reasonable. If someone tells you the average order preparation time is twenty minutes, that sounds excellent when your promise is one hour. But averages don't tell the whole story. To see why, imagine these two warehouses:
Warehouse A
- 18 minutes
- 20 minutes
- 21 minutes
- 19 minutes
- 22 minutes
Average preparation time: 20 minutes
Warehouse B
- 2 minutes
- 12 minutes
- 20 minutes
- 58 minutes
- 8 minutes
Average preparation time: 20 minutes
Both warehouses have exactly the same average, but would you rather manage Warehouse A or Warehouse B? Most people would choose Warehouse A immediately; not because it's faster, but because it's predictable. Customers don't experience averages; they experience individual orders. That's why Lean Six Sigma places such a strong emphasis on understanding variation rather than relying solely on averages.
Customer Requirements Define Whether a Process Is Capable
Earlier, we promised our customers that every order would be ready for shipment within one hour. That commitment is much more than a marketing statement; it becomes the standard our process must consistently achieve. Imagine that after monitoring thousands of orders, you discover that almost every order is prepared between 18 and 24 minutes. That's excellent. Even though every order takes a slightly different amount of time, every result is comfortably inside the one-hour window you've promised.
Now imagine business becomes busier. More products are added to the website, more warehouse employees are hired, and more software integrations are introduced. Suddenly, preparation times begin looking like this:
- 18 minutes
- 27 minutes
- 35 minutes
- 46 minutes
- 58 minutes
- 64 minutes
- 22 minutes
- 51 minutes
- 39 minutes
- 67 minutes
The business is still shipping orders, but something important has changed. Some customers are now waiting longer than the promised hour. As a result, customer complaints begin to appear, support agents spend more time answering "Where is my order?" emails, and expedited shipping refunds become more common. Nothing about this process is completely broken; it has simply become too inconsistent to reliably deliver what customers expect. That's exactly what Process Capability helps us measure.
So What Does Cp Actually Measure?
Imagine your software finishes its analysis and reports: Cp = 0.87. Is that good? You can't answer that question until you understand what the number is comparing.
Contrary to what many people assume, Cp is not a percentage. It isn't scored out of ten or one hundred, and there isn't even a maximum possible value. Instead, Cp compares two things: how much your process naturally varies, and how much variation your customer is willing to accept. That's all it does. Once you understand that comparison, interpreting the number becomes much easier.
Why Cp = 1.00 Is Such an Important Number
Imagine your customer allows one hour for every order to be prepared. Now imagine your process naturally varies just enough that some orders finish right at the edge of that promise. You haven't built in any breathing room or safety margin; your process fits the customer's requirement almost perfectly, but barely.
That situation is represented by: Cp = 1.00. Think of it as a process that has exactly enough capability to satisfy the customer, but no more. Any increase in variation could begin producing late orders, and any unexpected disruption could push more customers beyond your promised delivery time. In other words, the process has very little room for error.
Interpreting Your Cp Result
Once you understand what a Cp of 1.00 represents, the rest of the scale becomes surprisingly intuitive.
Cp less than 1.00
Your process varies more than your customer's acceptable range. Even if everything else were perfect, some customers will naturally receive results outside your promised requirement because the process simply varies too much. Given this, your next question shouldn't be: "How do I increase Cp?" Instead, it should be: "Why is my process producing so much variation?"
Are different employees following different procedures? Is one warehouse consistently slower than another? Is your payment gateway occasionally timing out, or are orders waiting for manual approval? The solution is rarely to calculate more statistics; it is to investigate the process itself.
Cp equal to 1.00
Your process has just enough capability to satisfy customer requirements. It works, but there isn't much room for unexpected problems.
Cp greater than 1.00
Your process variation fits comfortably inside the customer's acceptable range. The larger the number becomes, the more breathing room your process has before customers begin experiencing problems. That's why larger Cp values generally indicate a healthier process.
If Cp Already Tells Me My Process Is Capable, Why Does My Software Also Calculate Cpk?
Up to this point, we've only focused on one element: how much your process varies. If your process variation comfortably fits inside your customer's requirements, you'll generally see a higher Cp value. If your process variation is larger than your customer is willing to accept, you'll generally see a lower Cp value. Simple enough.
So why does every statistical software package also calculate something called Cpk? The answer is that Cp makes one very important assumption: it assumes your process is operating exactly where you want it to operate. Unfortunately, real business processes rarely stay there forever.
What Does "Centered" Actually Mean?
Earlier in the article, our warehouse was preparing most customer orders in around twenty minutes. Some orders finished in eighteen minutes, others took twenty-two, and a few took twenty-four. But if you looked at thousands of orders, you'd notice that most of them naturally finished at around the same point. In other words, twenty minutes had become the process's normal operating point.
This baseline is what Lean Six Sigma practitioners mean when they talk about the center of a process. It isn't a physical location or a setting inside your software; it's simply the result your process normally produces. In our example, the process naturally operates around twenty minutes which is its center.
What Happens When a Process Shifts?
Let's imagine your business introduces a new fraud detection system. It successfully blocks more fraudulent orders, but it also takes longer to verify legitimate payments. Nothing else changes. Warehouse staff work exactly the same way, packing procedures stay the same, and employees continue following the same standard operating procedures. Yet when you look at the data a month later, something has changed:
- 49 minutes
- 52 minutes
- 54 minutes
- 51 minutes
- 53 minutes
- 55 minutes
- 50 minutes
- 52 minutes
- 54 minutes
- 51 minutes
Something interesting has happened here. The process remains remarkably consistent, meaning orders are still taking roughly the same amount of time as each other and variation hasn't increased very much. However, the process is no longer operating around twenty minutes; it now naturally operates around fifty-two minutes. The entire process has shifted closer to the customer's one-hour expectation, and that shift dramatically changes the amount of risk your customers experience.
So What Does Cpk Measure?
While Cp only asks, "Does my process vary too much?" Cpk asks a second question: "Where is my process operating today?"
Earlier, our warehouse normally completed orders in around twenty minutes, leaving plenty of room before reaching the customer's one-hour commitment. After the payment system changed, the process shifted to a normal operating point of fifty-two minutes. Even though the variation is still small, moving closer to the customer's limit leaves far less room for unexpected delays. A busy afternoon, a temporary network outage, a slow payment gateway, or an employee calling in sick could now easily push orders beyond the promised timeline.
That threat is exactly why Cpk exists. It doesn't just consider how much your process varies; it also considers where your process is currently operating relative to your customer's requirement.
Understanding the Relationship Between Cp and Cpk
Imagine your software produces these results: Cp = 1.58 and Cpk = 0.81. At first glance, those numbers appear to contradict each other. How can the process have excellent capability and poor capability at the same time?
The answer is that they are measuring different things. A high Cp tells you the process doesn't vary very much, while a lower Cpk tells you the process is operating too close to one of the customer's limits. The process itself isn't highly variable; it's simply operating in the wrong place.
In our warehouse example, the business no longer needs a project to reduce variation. Instead, the first question should be: "Why has the process shifted from twenty minutes to fifty-two?" Has a software update introduced additional delays? Has staffing changed, or is inventory no longer positioned efficiently? Has a new approval step been added? Those are the business questions Cpk helps you ask.
My Software Calculated Cp and Cpk. What Should I Do Next?
This is the question that almost every professional eventually asks. Running a Process Capability Analysis is easy because modern software can calculate Cp and Cpk in seconds. The difficult part isn't generating the numbers; it's deciding what those numbers are trying to tell you. Let's look at some common situations.
Scenario 1: Both Cp and Cpk Are Below 1.00
Cp = 0.82
Cpk = 0.79
This symmetry usually points to one conclusion: the process varies too much. Even if you could shift the process average, it still wouldn't consistently meet customer requirements because it is simply too inconsistent.
Therefore, your first objective shouldn't be trying to blindly improve the metric. Your objective should be understanding why the process is producing so much variation. Investigate questions like:
- Are employees following different procedures?
- Are multiple systems performing the same task differently?
- Are suppliers introducing inconsistent inputs?
- Has additional complexity been added to the process?
- Is the process stable, or are unexpected events constantly disrupting it?
Notice something important: none of these questions require more statistics. They require understanding the process itself.
Scenario 2: Cp Is High but Cpk Is Low
Cp = 1.74
Cpk = 0.88
This situation often confuses people. How can one number suggest the process is excellent while the other suggests there is a problem?
Remember what each measurement represents: Cp tells us the process doesn't vary very much, while Cpk tells us where the process is currently operating. Going back to our warehouse example, imagine the warehouse still prepares orders very consistently. Let's say every order now takes between 50 and 54 minutes. That's remarkably consistent. The problem is that your customer expects every order to be ready within one hour. A process operating around 20 minutes has plenty of breathing room, whereas a process operating around 52 minutes has very little.
Your variation hasn't become the problem; your process has simply drifted too close to the customer's limit. Before launching a large improvement project, ask:
- What changed?
- Was new software introduced?
- Has staffing changed or a new approval step been added?
- Has demand increased dramatically?
- Has the process gradually slowed over time?
Your process may not need less variation. It may simply need to operate where it used to.
Scenario 3: Both Cp and Cpk Are High
Cp = 1.82
Cpk = 1.76
Congratulations! Your process appears to be both consistent and well positioned. It doesn't vary very much, nor is it operating dangerously close to your customer's requirements.
Does that mean you're finished? Not necessarily. Business processes are constantly changing: software gets updated, employees leave, suppliers change, and customer demand increases. Today's capable process can quickly become tomorrow's problem. The goal isn't to celebrate a standalone capability study; it's to continue monitoring the process so you notice changes before your customers do.
The Biggest Mistake People Make When Interpreting Cp and Cpk
One of the most common mistakes is treating Cp and Cpk like exam scores. People often ask, "Is 1.20 good?" or "Should I be worried because my Cpk dropped from 1.45 to 1.31?" While those aren't bad questions, they're simply the wrong first questions.
Cp and Cpk aren't grades, but rather clues. Their purpose isn't to tell you whether you've passed or failed, but to point you toward the next step you should investigate. That's why experienced Lean Six Sigma practitioners rarely stop after reading the numbers. Instead, they immediately look deeper: Why is the variation increasing? Why has the process shifted? When did this start happening, and what changed? Those questions improve processes; the capability indices simply tell you where to start looking.
Can You Improve Process Capability?
Absolutely. In fact, improving Process Capability is one of the primary goals of Lean Six Sigma. But before jumping into solutions, it's important to understand something that many improvement projects get wrong: You don't improve Cp or Cpk directly. You improve the process, and Cp and Cpk naturally follow suit.
Lean Six Sigma doesn't exist to increase a Cp value from 0.87 to 1.33. Those numbers are simply measurements of how your process is performing. Instead, Lean Six Sigma exists to identify and eliminate the underlying causes preventing your process from consistently meeting customer requirements. As the process improves, Cp and Cpk improve naturally.
So...What Should You Actually Do?
Let's return to our online retailer. Imagine you've completed a capability study and discovered your process isn't capable. Where do you begin? The answer depends entirely on why the process is struggling.
If the Process Varies Too Much...
Your investigation should focus on identifying the causes of inconsistency. Ask questions like:
- Are different employees performing the same task differently?
- Have standard operating procedures become outdated?
- Are software integrations occasionally failing?
- Do suppliers provide inconsistent information or materials?
- Are customers following different paths through the process?
- Is unnecessary waiting being introduced between process steps?
Every one of these variables can increase variation. Ultimately, your objective is to make the process behave more predictably.
If the Process Has Shifted...
Your investigation changes completely. The process may already be consistent, so the question now becomes: "What caused the process to start operating differently?"
Look for systemic changes such as:
- A software deployment or new payment provider.
- A warehouse layout change.
- Additional approval steps.
- New suppliers or seasonal demand increases.
- Changes in staffing or training.
Often, restoring the process to where it previously operated produces a much larger improvement than trying to reduce variation further. That's why understanding whether you're dealing with a variation problem or a process shift is so important.
Where Does Lean Six Sigma Fit Into All of This?
By now, you've probably noticed that Process Capability doesn't actually improve anything on its own; it simply measures. It tells you whether your process is capable, highlights when something has changed, and points you toward the right questions. But it doesn't fix the underlying issues.
That's where Lean Six Sigma comes in. It provides a structured methodology for understanding why a process isn't consistently meeting customer requirements and, more importantly, how to improve it. Rather than jumping straight to solutions, Lean Six Sigma teaches you how to investigate the process using data.
Is unnecessary variation being introduced? Has the process gradually shifted over time? Are customers waiting because of bottleneck approvals, software delays, or logistical blocks? These are exactly the kinds of questions Lean Six Sigma projects are designed to answer. The objective isn't simply to produce higher Cp and Cpk values; it's to build processes that consistently deliver what customers expect.
Final Thoughts
Software can calculate Process Capability in seconds, but improving it is a different challenge entirely. Throughout this article, we've deliberately avoided complicated statistical formulas because, in reality, they aren't where most improvement projects succeed or fail. Projects succeed because people understand what the data is telling them about the process.
A Cp value below 1.00 isn't simply a "bad number." It's evidence that your process is producing more variation than your customer is willing to accept. Similarly, a lower Cpk isn't just another statistic; it's often the first warning that your process has begun drifting away from its target baseline.
Those numbers aren't the destination; they're the starting point. Every capability study should lead to better questions: Why has the process changed? What's creating unnecessary variation? What does the customer actually need? And how can we redesign the process so those requirements are met consistently? That's what Process Capability is really about; not statistics, not software, and certainly not passing an exam. It's about understanding whether your process can consistently deliver what your customers expect and having the confidence to improve it when it doesn't.
Frequently Asked Questions
1. What is a good Cp value?
A Cp value of 1.00 means your process has just enough capability to meet your customer's requirements, leaving very little room for unexpected variation. Values greater than 1.00 indicate that your process variation fits more comfortably within customer requirements. Many organizations aim for higher values depending on the level of quality or risk required. Rather than focusing strictly on whether a Cp value is good, it's usually more useful to ask whether your process is capable of consistently delivering what your customers expect.
2. Why is my Cpk lower than my Cp?
A lower Cpk usually means your process has shifted closer to one of your customer requirements. The amount of variation may still be acceptable, but the process is no longer operating where it normally should. Investigating what caused that drift is often more valuable than immediately trying to reduce variation.
3. Can Cpk ever be higher than Cp?
No. Cp measures the potential capability of a process assuming it is operating where you want it to operate, while Cpk also factors in where the process is currently operating. Because of this structural math, Cpk can never be greater than Cp.
4. My software says my process isn't capable. What should I do first?
Don't immediately start changing the process. First, determine why the capability is poor: Is the process producing too much variation, or has the entire process shifted closer to your customer requirement? Answering that question will usually determine the direction of your improvement effort.
5. Does Process Capability only apply to manufacturing?
Not at all. Any repeatable process with measurable results and customer requirements can be evaluated using Process Capability. Examples include online order fulfillment, software deployment, customer support, finance, healthcare, logistics, HR, and countless other business workflows.
6. What software can calculate Cp and Cpk?
Many statistical and quality improvement tools can perform Process Capability Analysis. Popular options include Minitab, JMP, KNIME, SigmaXL, QI Macros, Python libraries, R, and other statistical software packages. Regardless of which software you use, understanding how to interpret the results is far more important than knowing which button generated them.
7. Can I improve Cp without improving my process?
No. Cp and Cpk are objective measurements of process performance; they improve only when the process improves. The objective should never be to chase better numbers, but rather to eliminate the underlying causes preventing the process from consistently meeting customer requirements.
8. Is Process Capability the same as Process Performance?
No. Although the terms are often confused, Process Capability and Process Performance answer different questions and use different metrics. Process Capability typically uses Cp and Cpk, while Process Performance commonly uses Pp and Ppk.